Description
Acoustic Voice Quality Index v.02.06
The Acoustic Voice Quality Index (i.e., AVQI) has been developed to do what its name says: to measure overall voice quality with objective and acoustic markers for clinical purposes. It is actually based on four premises. First, auditory perception is the subjective criterion upon which any objective tool has to be validated. Second, because such clinical and auditory-perceptual ratings of overall voice quality and dysphonia severity differ between two speech tasks such as sustained vowel continuous speech (Maryn & Roy, 2012), the AVQI needs to reflect overall voice quality from at least these two speech tasks in order to be representative for daily voice use patterns. Third, overall voice quality is multidimensional and thus not related to a sole physical variable or a unique psychoacoustical determinant. It is linked to phenomena occuring in different signal domains (click here for more information on time-domain, frequency-domain and quefrency-domain), and therefore the AVQI should be constructed on multiple acoustic markers from different domains. Fourth, for the AVQI to be useful in clinical voice practice for tracking overall voice quality in time and across treatment, it has to be sufficiently valid, accurate and above all responsive to change. All information on the development of the AVQI can be found in Maryn et al. (2010a). With the PHONANIUM script for Acoustic Voice Quality Index v.02.06 in the program Praat it is possible to yield this objective correlate of dysphonia severity at both baseline and follow-up voice assessments.
Authors of the Acoustic Voice Quality Index v.02.06 script
Youri Maryn
Paul Corthals
Included in this download
- Access to tutorial video with concise theory and illustration(s) on how to use this AVQI script and how to interpret its graphical and numerical outputs
- Access to tutorial video with concise theory and illustration(s) on how to evaluate the quality of sound recordings
- Access to tutorial video on how to work with the Personal information – New file script
- Access to tutorial video on how to implement/install plug-ins in the program Praat
- This plug-in
Plug-in details
Name of plug-in
plugin_PHONANIUM_AVQI_v.02.06
Content of plug-in
- Acoustic Voice Quality Index v.02.06.praat: to determine the AVQI v.02.06 with PHONANIUM’s script in the program Praat.
- setup.praat: to couple this script to a button in the dynamic menu of the program Praat.
How to install this plug-in?
First, make sure to have downloaded and installed the program Praat (free available at www.praat.org) on your computer. Than download this plug-in.
Once downloaded, unzip the folder entitled plugin_PHONANIUM_AVQI_v.02.
- Windows (Vista or later): C:\Users\Emiel\Praat\.
- Mac OSX: /Users/Emiel/Library/Preferences/Praat Prefs/. (However, sometimes the Library folder is hidden on a Mac OSX. If this is the case, you first open Finder, select the Go menu, and then press the alt key ⌥. While pressing the alt key ⌥, the Library becomes available as an option in the Go menu and can then be clicked/opened.)
- Linux: /UserName/.praat-dir/.
What is the Acoustic Voice Quality Index?
The AVQI, as described in Maryn & Weenink (2015), is a multivariate construct that combines the following six acoustic markers from the program Praat to yield a single number that correlates reasonably with overall dysphonia severity: smoothed cepstral peak prominence (i.e., CPPS), harmonics-to-noise ratio (i.e., HNR), shimmer local (i.e., SL), shimmer local dB (i.e., SLdB), general slope of the long-term average spectrum (i.e., Slope), and tilt of the regression line through the long-term average spectrum (i.e., Tilt). Auditory-perceptual ratings of overall voice quality (a.k.a. hoarseness or dysphonia severity) according to the ‘G’ or ‘grade’ scale of the Japan Society for Logopedics and Phoniatrics (Hirano, 1981) or to the ‘OS’ or ‘overall severity’ scale of the CAPE-V protocol of the American Speech-Language-Hearing Association (Kempster et al., 2009) have a directly proportional relationship with the AVQI. This means that more severely perceived dysphonia corresponds with higher AVQI scores, and vice versa. The AVQI ranges between 0 and 10 and has a clinical cut-off score between normophonia and dysphonia somewhere around 3 depending on the language and the continuous speech material on which it has been validated (see below). An AVQI score between 0 and threshold denotes normophonia. An AVQI score between threshold and 10 denotes dysphonia, from slightly dysphonic just above threshold to most severely disturbed voice quality in the vicinity of 10.
What is the clinical value of the Acoustic Voice Quality Index?
There already have been multiple studies assessing various facets of AVQI’s validity in different studies. The first facet is concurrent validity. this addresses the question: how well can the AVQI measure the severity of dysphonia/hoarseness across a set of clinical voice samples? The second facet is diagnostic accuracy. This addresses the question: how accurate is the AVQI in determining whether someone does or does not have dysphonia/hoarseness? The third and most important facet is responsiveness to change. This addresses the question: how proficient is the AVQI in tracking auditorily perceived changes in overall voice quality across time and treatment? One or more of these facets have been investigated in the following independent studies: Maryn et al. (2010a), Maryn et al. (2010b), Barsties & Maryn (2012), Reynolds et al. (2012), Maryn et al. (2014), Barsties & Maryn (2015), Maryn et al. (2015), Kankare et al. (2016), Barsties & Maryn (2015), Hosokawa et al. (2016) and Uloza et al. (2016). All these studies had different recording systems, protocols and environments. Their study groups consisted of different speaker types in terms of demography and laryngeal pathology. Their continuous speech samples came from different languages and phonetic configurations. Their experimental rating panels included differences in terms of internal standards and experience. Their ratings differed in perceptual scale (mostly G, but sometimes also OS). However, despite all these differences across studies, the AVQI appears to be exceptionally robust. With an average correlation of 0.84, it can be concluded that the AVQI is strong (though not perfect) in quantifying auditory perceptions of level of hoarseness. Furthermore, with an average sensitivity of 0.85, an average specificity of 0.88, and an average area under ROC curve of 0.92, the AVQI can be considered to acceptably accurate (though not completely error-free) in distinguishing between normophonia and dysphonia. Finally, with an average correlation of 0.78 between changes in perceived dysphonia severity and changes in AVQI, the AVQI can be regarded as a strong tool for following up on changes in overall voice quality across time for tracking voice treatment outcomes. Based on all these statistics in can be concluded that the AVQI is a valid tool in clinical voice assessment as well as treatment.
Interpretation of the AVQI
First, the AVQI score lies between 0 and 10. The lower this number, the less dysphonia/hoarseness and the better the voice quality. Second, the AVQI partly depends on recordings of continuous speech and therefore there are language-dependent thresholds between normal and disordered voice quality. The table below lists AVQI cut-off scores for the languages that have been investigated so far. PHONANIUM offers multiple scripts for determining AVQI, each with their own threshold score depending on the language in which it has to be used. Third, when using AVQI as a follow-up tool, one has to take a minimal difference of 0.54 into account. This means that the difference between two AVQI scores has to be at least 0.54 to be considered a true change in overall voice quality (i.e., a change that is not due to measurement error or test-retest variability) (Barsties & Maryn, 2013).
| Language | Threshold scores | Study |
| Dutch | 2.95 | Maryn et al. (2010a) |
| English, Australian | 3.46 | Reynolds et al. (2012) |
| Finnish | 3.09 | Kankare et al. (2016) |
| French | 3.07 | Maryn et al. (2014) |
| German | 2.70 | Barsties & Maryn (2012) |
| Japanese | 3.15 | Hosokawa et al. (2016) |
| Korean | 2.02 | Maryn et al. (2015) |
| Lithuanian | 2.97 | Uloza et al. (2016) |
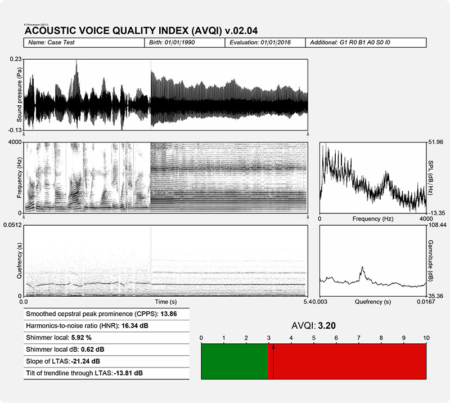
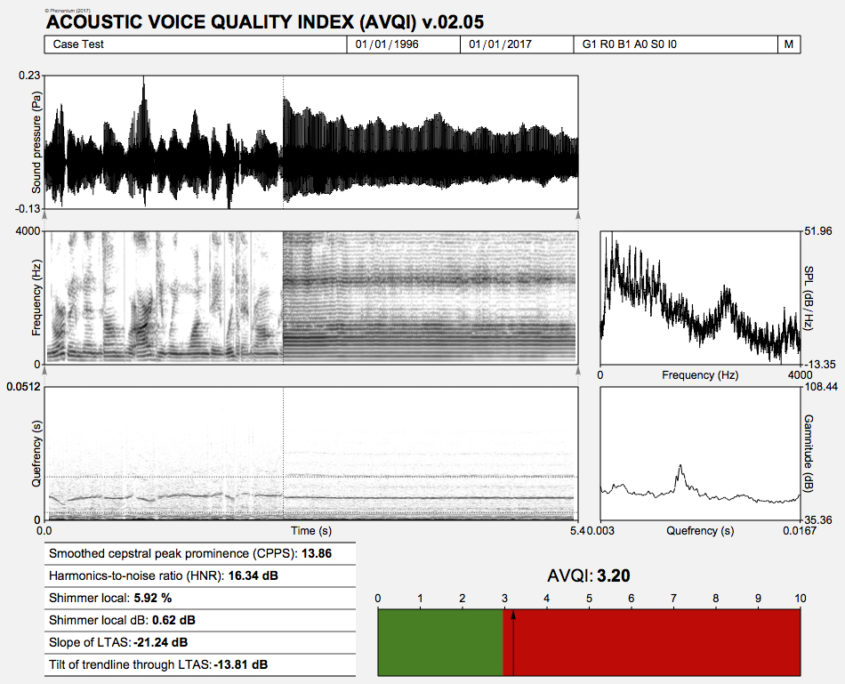
In the output of PHONANIUM’s script to determine the AVQI, a complementary set of charts and statistics is offered to accompany the auditory-perceptual interpretation of overall voice quality (i.e., dysphonia severity or hoarseness). In this example, the Dutch sentences ‘Papa en Marloes staan op het station. Ze wachten op de trein.’ and three medial seconds of [a:] produced by a dysphonic female with G2 were recorded and analyzed. The top graph is an oscillogram (i.e., the acoustic waveform, as captured by the microphone and digitized by the sound card). The left graph in the middle represents the sound spectrogram depicting the spectral configuration from 0 to 4 kHz. The right graph in the middle is the long-term average spectrum (i.e., LTAS, a summary of all discrete sound spectra across the duration of the sample under investigation). The left graph at the bottom represents the sound cepstrogram depicting the cepstral configuration from 0 s to 0.0512 s (corresponding with a lower fo boundary of 1/0.0512 = 19.5 Hz). The right bottom graph is the average cepstrum (i.e., a summary of all discrete sound cepstra across the duration of the sample under investigation) with quefrency from 0.00303 s (corresponding with an upper fo boundary of 1/0.00303 = 330 Hz) to 0.01667 s (corresponding with a lower fo boundary of 1/0.01667 = 60 Hz). Underneath these figures there are the six acoustic markers that constitute the AVQI on the left, and finally, the AVQI score itself on the right as a number and as a mark on a horizontal bar with a continuous scale from 0 to 10. The green zone from 0 to preset threshold designates the range of normophonia. The red zone from preset threshold to 10 designates the range from very slight to most severe dysphonia.
Phonanium’s script for AVQI: specific features
Preconditions
- To rename the three seconds part of the sustained [a:] to ‘sv’, after sustained vowel (so the object in the list is named ‘Sound sv’).
- To rename the continuous speech part to ‘cs’, after continuous speech (so the object in the list is named ‘Sound cs’).
Pre-analysis functions and formatting
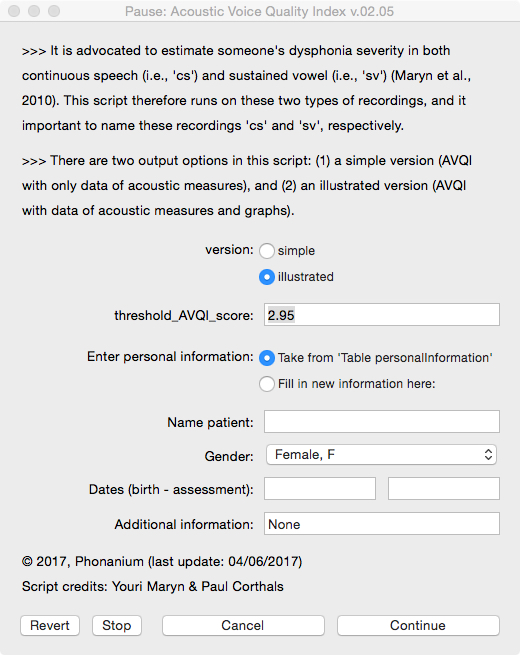
Before analyzing the voice/speech signal, the user is prompted in a form:
- to decide on the output of the script (simple without graphs, or illustrated with graphs);
- to decide on the threshold score (2.95 by default, but with a memory function when altered);
- to enter personal information (i.e., name, date of birth, date of assessment and additional information) directly in this form, or to take this information after having it entered in the form of the Phonanium script entitled ‘Personal information’.
Graphical information output
- Oscillogram (sound wave)
- Sound spectrogram
- Long-term average spectrum
- Sound cepstrogram
- Averaged cepstrum
- AVQI bar
Numerical/statistical information output in Hz as well as semitone (relative to 1 Hz)
- Acoustic Voice Quality Index
- Smoothed cepstral peak prominence
- Harmonics-to-noise ratio
- Shimmer local
- Shimmer local dB
- Slope of LTAS
- Tilt of trendline through LTAS
Important: quality of sound recording
Many of the acoustic analyses and clinically relevant voice markers in the scripts of PHONANIUM imply sophisticated and complex procedures. However, when they are run on signals with bad recording quality, they loose their clinical value in terms of validity and reliability. So, prior to undertaking high-standard acoustic voice analyses, clinicians have to make well-considered choices in all of the following elements in the audio recording chain: room acoustics and ambient noise, type and placement of microphone, microphone preamplifier, and digital audio capturing device. To sample all relevant vocalizations and speech tokens as least polluted by recording-related noise as possible is what it essentially comes down to. For example Maryn (2017) offers an overview on how to deal with this.
Click here to visit PHONANIUM’s page on how to minimize recording-related influences on voice/speech signals.
Important: use the ‘Personal information’ script
With the script ‘Personal information v.01.02’ the user can complete an electronic form with the subject’s/patient’s name, date of birth, date of assessment, and optionally extra information. All this information (a) is than written into a table, (b) will be consulted by the other PHONANIUM scripts if the option “Take from ‘Table personalInformation’” is selected, and (c) will be written automatically in the output of these scripts. This increases the user-friendliness of working with PHONANIUM scripts in the program Praat, as the user/clinician has to complete this personal information only once during the entire voice assessment session.
Click here to visit PHONANIUM’s page on this ‘Personal information v.01.02’ script.
Disclaimer
For customers in the EU: this software currently has no CE certification. We are in the process of application. In the meantime, this software can be used for scientific as well as educational/learning purposes.
Program Praat
Click here to visit the website where the program Praat (Paul Boersma & David Weenink, Institute for Phonetic Sciences, University of Amsterdam, The Netherlands) can be downloaded. This software runs under the GNU General Public License. Click here to download this license.
References
Barsties B, Maryn Y (2012). Der Acoustic Voice Quality Index in deutsch: ein Messverfahren zur allgemeinen Stimmqualität [The Acoustic Voice Quality Index: toward expanded measurement of dysphonia severity in German subjects]. HNO, 60, 715-720.
Barsties B, Maryn Y (2013). Test-Retest-Variabilität und interne Konsistenz des Acoustic Voice Quality Index [Test-retest variability and internal consistency of the Acoustic Voice Quality Index]. HNO, 61, 399-403.
Barsties B, Maryn Y (2015). The improvement of internal consistency of the Acoustic Voice Quality Index. American Journal of Otolaryngology, 36, 647-656.
Barsties B, Maryn Y (2016). External validation of the Acoustic Voice Quality Index version 03.01 with extended representativity. Annals of Otology, Rhinology and Laryngology, 125, 571-583.
Hirano M (1981). Psycho-acoustic evaluation of voice. In: Arnold GE, Winckel F, Wyke BD, (editors). Disorders of Human Communication 5. Clinical Examination of Voice, 81-84. Vienna, Austria: Springer-Verlag.
Hosokawa K, Barsties B, Iwahashi T, Iwahashi M, Kato C, Iwaki S, Sasai H, Miyauchi A, Matsushiro N, Inohara H, Ogawa M, Maryn Y (2016). Validation of the Acoustic Voice Quality Index in the Japanese language. Journal of Voice, Jun 7, epub ahead of print.
Kankare E, Barsties B, Maryn Y, Ilomäki I, Laukkanen A-M, Rantala L, Tyrmi J, Asikainen M, Härkönen P, Vilpas S (2016). The Acoustic Voice Quality Index in Finnish speaking population. 30th IALP World Congress, Dublin, Ireland.
Kempster GB, Gerratt BR, Verdolini Abbott K, Barkmeier-Kraemer J, Hillman RE (2008). Consensus auditory-perceptual evaluation of voice: development of a standardized clinical protocol. American Journal of Speech-Language Pathology, 18, 124-132.
Maryn Y, Corthals P, Van Cauwenberge P, Roy N, De Bodt M (2010a). Toward improved ecological validity in the acoustic measurement of overall voice quality: combining continuous speech and sustained vowels. Journal of Voice, 24, 540-555.
Maryn Y, De Bodt M, Roy N (2010b). The Acoustic Voice Quality Index: toward improved treatment outcomes assessment in voice disorders. Journal of Communication Disorders, 43, 161-174.
Maryn Y, Roy N (2012). Sustained vowels and running speech in the auditory-perceptual evaluation of dysphonia severity. Jornal da Sociedade Brasileira de Fonoaudiologia, 24, 107-112.
Maryn Y, De Bodt M, Barsties B, Roy N (2014). The value of the Acoustic Voice Quality Index as a measure of dysphonia severity in subjects speaking different languages. European Archives of Oto-Rhino-Laryngology, 271, 1609-1619.
Maryn Y, Weenink D (2015). Objective dysphonia measures in the program Praat: smoothed cepstral peak prominence and acoustic voice quality index. Journal of Voice, 29, 35-43.
Maryn Y (2017). Practical acoustics in clinical voice assessment: a Praat primer. Perspectives of the ASHA Special Interest Groups, SIG3, 2, Part 1.
Reynolds V, Buckland A, Bailey J, Lipscombe J, Nathan E, Vijayasekaran S, Kelly R, Maryn Y, French N (2012). Objective assessment of paediatric voice disorders with the Acoustic Voice Quality Index. Journal of Voice, 26, 672.e1-7.
Uloza V, Petrauskas T, Padervinskis E, Ulozaitė N, Barsties B, Maryn Y (2016). Validation of the Acoustic Voice Quality Index in the Lithuanian language. Journal of Voice, Jul 14, epub ahead of print.
Updates
AVQI v.02.06
- Resolve of error message ‘Table “matrixToTable”: the cell in row 585 of column 1 is undefined’.
- Addition of a free field for the gender entry under ‘personal information’, to account for issues related to gender diversity.

