Description
Sound spectrography and acoustic voice markers (v.02.03)
“The amount of information displayed in a spectrogram–even one of a simple utterance–can be enormous. … Every aspect of speech motor behavior contributes to the final acoustic product and, therefore, the spectrogram is likely to tell the clinician more than he wants to know about any given utterance. … The interpretation of sound spectrograms rests on a thorough knowlegde of the acoustics and physiology of speech, on familiarity with the way which spectrograms are generated, on experience, and on a practiced eye.” (Baken & Orlikoff, 2000, p. 226). Indeed, all facets of vocal sound are made visible in the spectrogram, i.e., the narrowband spectrogram to be specific. Fundamental frequency, relative intensity level, harmonics, noise, stability/instability (due to, e.g., tremor, vibrato, voice breaks, and/or unvoiced fragments), irregularity, subharmonics or multiplophonia, multiphonia, voice onset, etc. can all be made visible in the narrowband spectrogram and therefore be interpreted with reasonable ease. Consequently, the sound spectrogram is one of the key graphs in clinical voice sound assessment. With the PHONANIUM script for showing the sound spectrogram and measuring various time- and frequency-domain voice markers in the program Praat, all relevant aspects and statistics can easily be obtained for different voice/speech tasks.
Author of the Spectrography and acoustic measures v.02.03 script
Youri Maryn
Included in this download
- Access to tutorial video with concise theory and illustration(s) on how to use this Spectrography script and how to interpret its graphical and numerical outputs from different tasks and in several cases with various types and degrees of dysphonia
- Access to tutorial video with concise theory and illustration(s) on how to calibrate intensity level measurements
- Access to tutorial video with concise theory and illustration(s) on how to evaluate the quality of sound recordings
- Access to tutorial video on how to work with the Personal information – New file script
- Access to tutorial video on how to implement/install plug-ins in the program Praat
- This plug-in
Plug-in details
Name of plug-in
plugin_PHONANIUM_Spectrography_v.02.03
Content of plug-in
- Spectrography and acoustic measures v.02.03.praat: to run spectrographic analyses with PHONANIUM’s script in the program Praat.
- setup.praat: to couple this script to a button in the dynamic menu of the program Praat.
- calibrationParameters.Table: a table in which previously and currently entered calibration data are stored. The last data set is used for calibration of the intensity levels measured in this script.
How to install this plug-in?
First, make sure to have downloaded and installed the program Praat (free available at www.praat.org) on your computer. Than download this plug-in.
Once downloaded, unzip the folder entitled plugin_PHONANIUM_Spectrography_v.02.03 and place it in the following directory (i.e., the preferences directory of the program Praat), depending on your computer operating system and the name of the user (for example ‘Emiel’):
- Windows (Vista or later): C:\Users\Emiel\Praat\.
- Mac OSX: /Users/Emiel/Library/Preferences/Praat Prefs/. (However, sometimes the Library folder is hidden on a Mac OSX. If this is the case, you first open Finder, select the Go menu, and then press the alt key ⌥. While pressing the alt key ⌥, the Library becomes available as an option in the Go menu and can then be clicked/opened.)
- Linux: /UserName/.praat-dir/.
What is a sound spectrogram?
Simply phrased, the modern sound spectrogram –also known as ‘voice print’, ‘sonagram’, or even ‘visible speech’– is a three-dimensional representation of spectra over time, with time on the x-axis, frequency on the y-axis, and spectral amplitude (per frequency, and per instance) on the grey scale. Display of all this information depends on sampling rate (and consequently on frequency range under investigation), frequency resolution versus time resolution, scale (linear versus logarithmic), and pre-emphasis. See Baken & Orlikoff (2000) for a comprehensive review regarding sound spectrography.
Especially important is the trade-off between details in time and details in frequency, which is determined by the analysis window duration or length. A short analysis time window (e.g., 0.005 s) offers high temporal resolution. This means that two events occuring close in time (e.g., two adjacent glottal cycles in a vocal fold vibration) can still be distinguished as separate. However, the sacrifice of this is low frequency resolution. A sound spectrogram with such short analysis windows is a so-called wideband (or broadband) spectrogram. A long analysis time window (e.g., 0.03 s), on the other hand, offers low temporal resolution. This means that two events occuring close in time cannot be distinguished from each other. But its benefit is a highly detailed frequency resolution, with the capacity to show e.g. discrete harmonics in voiced sounds. A sound spectrogram with such low analysis windows is a so-called narrowband (or smallband) spectrogram.
For the purpose of clinical voice assessment, the narrowband spectrogram is preferred, as it displays items related to vocal fold vibration across the recording/sample under investigation: fundamental frequency, aspiration noise, harmonics, relative intensity level, subharmonics, unvoiced segments, cyclic modulations, etc. For clinical speech assessment, however, the broadband spectrogram is more interesting, because it shows phoneme-related items such as formant/antiformant frequency and formant/antiformant bandwidth across the recording/sample under investigation. Instead of assessing voice-related phenomena, it can be utilized to investigate articulatory and resonatory features of speech. PHONANIUM’s sound spectrography script works with an analysis window of 0.03 s by default and thus automatically produces as smallband spectrogram.
What is the clinical value of the sound spectrogram?
The actual power of the sound spectrogram in the voice and speech clinic can be found in its potential to visualize all voice/speech sound peculiarities in a single picture.
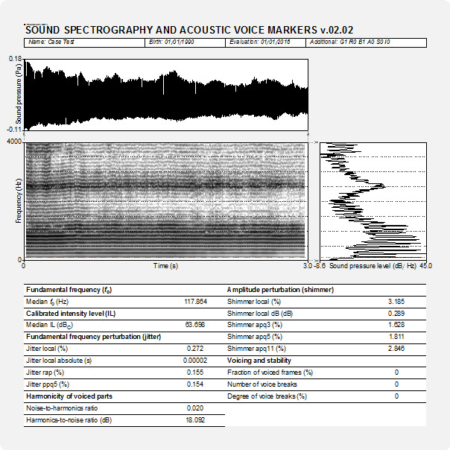
In the output of PHONANIUM’s sound spectrography script, a complementary set of charts and statistics are shown to accompany the auditory-perceptual interpretation of voice signals. The top graph is an oscillogram (i.e., the acoustic waveform, as captured by the microphone and digitized by the sound card). The following graph on the left is the narrowband spectrogram depicting the spectral configuration up to 4000 Hz in time, as discussed above. The lower right graph is the long-term average spectrum (i.e., LTAS; a summary of all discrete sound spectra across the duration of the sample under investigation) with frequency from bottom to top aligned with spectrogram. Underneath these figures there are some acoustic markers providing time-domain (i.e., fo, intensity level, jitter, shimmer, and voice breaks) as well as frequency-domain (i.e., noise-to-harmonics ratio, and harmonics-to-noise ratio) information from the program Praat’s well-known Voice report.
Regarding the relation between sound spectrography and auditory voice quality ratings, Yanagihara (1967) developed a visual-perceptual ordinal four-point classification system of narrowband spectrograms based on the prominence of harmonic versus noise energy in specific formant zones and frequency regions. Although already a vintage method, this classification system has proven to be strongly associated with auditory-perceptual ratings of hoarseness (Yumoto et al., 1984; Wolfe & Steinfatt, 1987), as well as with objective acoustic voice quality markers such as harmonics-to-noise ratio (Yumoto et al., 1982) and signal-to-dysperiodicity ratio (Bettens et al., 2005). Another classification systems based on three periodicity and oscillation types have been described by Titze (1995) and expanded with a fourth type by Sprecher et al. (2010). A recent study of Barsties et al. (2016) demonstrated that the latter classification system correlated fairly with auditory-perceptual ratings of grade (i.e., ‘G’) and breathiness (i.e., ‘B’). Furthermore, Martens et al. (2010), and to a much lesser extend also Barsties et al. (2017), pointed out that the addition of narrowband spectrograms clearly increase the interrater reliability for G, B and roughness (i.e., ‘R’).
Sound spectrography thus provides very relevant information to the voice and speech clinician.
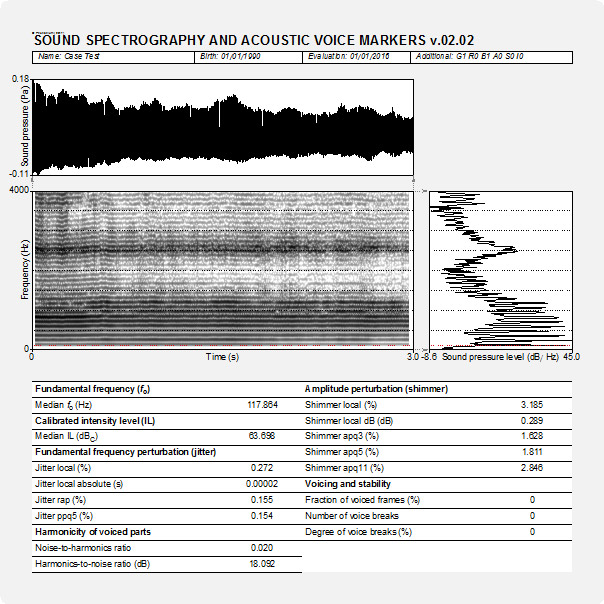
Phonanium’s script for sound spectrography: specific features
Pre-analysis functions and formatting
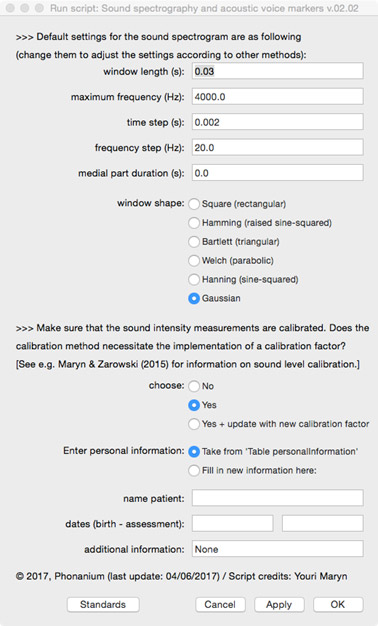
Before analyzing the voice/speech signal, the user is prompted in a first form:
- to decide on various parameters for the spectrogram (i.e., window length, maximum frequency, time step, frequency step, and window shape);
- to decide on various parameters for drawing the spectrogram (i.e., duration of the medial signal part, frequency range, primary unit, maximum height, dynamic range, pre-emphasis, and dynamic compression);
- to enter personal information (i.e., name, date of birth, date of assessment and additional information) directly in this form, or to take this information after having it entered in the form of the Phonanium script entitled ‘Personal information’.
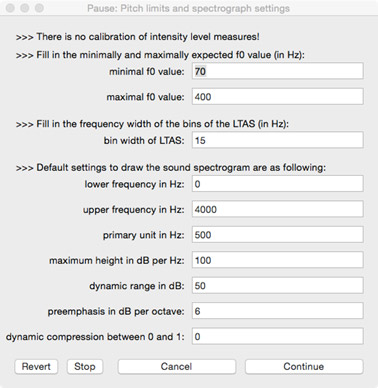
The user is prompted in a second form:
- to decide on the fundamental frequency window in which vocal fo statistics are to be found;
- to choose if an intensity level calibration factor is to be implemented, and if yes, which dB scale was used during the calibration procedure;
- to decide on the bin width for the LTAS.
Graphical information output
- Oscillogram (sound wave)
- Sound spectrogram
- LTAS
Numerical/statistical information output in Hz as well as semitone (relative to 1 Hz)
- Median fo
- Median IL
- Jitter local
- Jitter local absolute
- Jitter rap
- Jitter ppq5
- Noise-to-harmonics ratio
- Harmonics-to-noise ratio
- Shimmer local
- Shimmer local dB
- Shimmer apq3
- Shimmer apq5
- Shimmer apq11
- Fraction of voice frames
- Number of voice breaks
- Degree of voice breaks
Important: calibration of vocal intensity level measurement
For clinical measurements of vocal intensity levels in the vocal range estimation to be reliable, it is essential to be calibrated before recording and analyzing sound signals (Ma, 2011). A straightforward method for calibration of the vocal intensity level has been described and found feasible, valid and accurate by Maryn & Zarowski (2016). This script automatically calibrates your intensity level measures when these data have been implemented/completed.
Click here to visit PHONANIUM’s page on vocal intensity level calibration.
Important: quality of sound recording
Many of the acoustic analyses and clinically relevant voice markers in the scripts of PHONANIUM imply sophisticated and complex procedures. However, when they are run on signals with bad recording quality, they loose their clinical value in terms of validity and reliability. So, prior to undertaking high-standard acoustic voice analyses, clinicians have to make well-considered choices in all of the following elements in the audio recording chain: room acoustics and ambient noise, type and placement of microphone, microphone preamplifier, and digital audio capturing device. To sample all relevant vocalizations and speech tokens as least polluted by recording-related noise as possible is what it essentially comes down to. For example Maryn (2017) offers an overview on how to deal with this.
Click here to visit PHONANIUM’s page on how to minimize recording-related influences on voice/speech signals.
Important: use the ‘Personal information’ script
With the script ‘Personal information v.01.02’ the user can complete an electronic form with the subject’s/patient’s name, date of birth, date of assessment, and optionally extra information. All this information (a) is than written into a table, (b) will be consulted by the other PHONANIUM scripts if the option “Take from ‘Table personalInformation’” is selected, and (c) will be written automatically in the output of these scripts. This increases the user-friendliness of working with PHONANIUM scripts in the program Praat, as the user/clinician has to complete this personal information only once during the entire voice assessment session.
Click here to visit PHONANIUM’s page on this ‘Personal information v.01.02’ script.
Disclaimer
For customers in the EU: this software currently has no CE certification. We are in the process of application. In the meantime, this software can be used for scientific as well as educational/learning purposes.
Program Praat
Click here to visit the website where the program Praat (Paul Boersma & David Weenink, Institute for Phonetic Sciences, University of Amsterdam, The Netherlands) can be downloaded. This software runs under the GNU General Public License. Click here to download this license.
References
Baken RJ, Orlikoff RF (2000). Clinical measurement of speech and voice. San Diego, CA: Singular Publishing Group.
Barsties B, Hoffmann U, Maryn Y (2016). [The Evaluation of Voice Quality via Signal Typing in Voice using Narrowband Spectrograms]. Laryngorhinootologie, 95, 105-111.
Barsties B, Beers M, Ten Cate L, Van Ballegooijen K, Braam L, De Groot M, Van Der Kant M, Kruitwagen C, Maryn Y (2017). The effect of visual feedback and training in auditory-perceptual judgment of voice quality. Logopedics Phoniatrics Vocology, 42, 1-8.
Bettens F, Grenez F, Schoentgen J (2005). Estimation of vocal dysperiodicities in disordered connected speech by means of distant-sample bidirectional linear predictive analysis. Journal of the Acoustical Society of America, 111, 328-337.
Martens JW, Versnel H, Dejonckere PH (2007). The effect of visible speech in the perceptual rating of pathological voices. Archives of Otolaryngology–Head & Neck Surgery, 133, 178-185.
Maryn Y (2017). Practical acoustics in clinical voice assessment: a Praat primer. Perspectives of the ASHA Special Interest Groups, SIG3, 2, Part 1.
Sprecher A, Olszewski A, Jiang JJ, Zhang Y (2010). Updating signal typing in voice: addition of type 4 signals. Journal of the Acoustical Society of America, 127, 3710-3716.
Titze IR (1995). Workshop on acoustic voice analysis: summary statement. Denver, CO: National Center for Voice and Speech.
Wolfe VI, Steinfatt TM (1987). Prediction of vocal severity within and across voice types. Journal of Speech and Hearing Research, 30, 230-240.
Yumoto E, Gould WJ, Baer T (1982). Harmonics-to-noise ratio as an index of the degree of hoarseness. Journal of the Acoustical Society of America, 71, 1544-1550.
Yumoto E, Sasaki Y, Okamura H (1984). Harmonics-to-noise ratio and psychophysical measurement of the degree of hoarseness. Journal of Speech and Hearing research, 27, 2-6.
Yanagihara N (1967). Significance of harmonic changes and noise components in hoarseness. Journal of Speech and Hearing Research, 10, 531-541.
Additional reading on vocal fo, perceived pitch and related issues
Behrman A (2007). Speech and voice science. San Diego, CA: Plural Publishing.
Kent RD, Read C (2002). Acoustic analysis of speech (2nd edition). San Diego, CA: Singular Publishing Group.
Kreiman J, Sidtis D (2011). Foundations of voice studies. An interdisciplinary approach to voice production and perception. Chichester, UK: Wiley-Blackwell.
Ma EP-M, Yiu EM-L (2011). Handbook of voice assessments. San Diego, CA: Plural Publishing.
Titze IR (1994). Principles of voice production. Englewood Cliffs, NJ: Prentice Hall.
Titze IR (2006). The myoelastic aerodynamic theory of phonation. Iowa City, IA: National Center for Voice and Speech.
Updates
Sound spectrography and acoustic voice markers (v.02.03)
- Addition of a free field for the gender entry under ‘personal information’, to account for issues related to gender diversity.

