Description
Sound cepstrography and quefrency-domain analyses v.01.02
In a meta-analysis on the validity of single acoustic markers in measuring overall voice quality, Maryn et al. (2009) wrote “Collectively, measures derived from the cepstrum (such as cepstral peak prominence and smoothed cepstral peak prominence) can be used in sustained vowel as well as continuous speech samples because they do not rely on accurate fundamental period detection, and they can be easily implemented in clinical settings. (p. 2631)” and “This cepstral metric [i.e., the smoothed cepstral peak prominence] thus can be regarded as the most promising and perhaps robust acoustic measure of dysphonia severity. (p. 2633)”. Based on an impressive multitude of studies so far –starting with Hillenbrand et al. (1994) and Hillenbrand & Houde (1996), up to more recently with for example Heman-Ackah et al. (2002), Halberstam (2004), Awan et al. (2009), Maryn et al. (2010), Lowell et al. (2013), Heman-Ackah et al. (2014)– the cepstrum with its related analysis techniques and markers has proven to be a feasible, valid and robust domain for measuring voice quality/dysphonia severity. Therefore, cepstral analysis of voice sounds has become a conditio sine qua non in clinical voice assessment. With the PHONANIUM script for analyzing voice/speech sounds with cepstral methods and measuring various quefrency-domain voice markers in the program Praat, all relevant aspects and statistics can easily be obtained for different voice/speech tasks.
Author of the Cepstrography v.01.02 script
Youri Maryn
Included in this download
- Access to tutorial video with concise theory and illustration(s) on how to work with this Cepstrography script
- Access to tutorial video with concise theory and illustration(s) on how to evaluate the quality of sound recordings
- Access to tutorial video on how to work with the Personal information – New file script
- Access to tutorial video on how to implement/install plug-ins in the program Praat
- This plug-in
Name of plug-in
plugin_PHONANIUM_Cepstrography_v.01.02
Content of plug-in
- Powercepstrogram and powercepstrum v.01.02.praat: to run cepstrographic analyses with PHONANIUM’s script in the program Praat.
- setup.praat: to couple this script to a button in the dynamic menu of the program Praat.
How to install this plug-in?
First, make sure to have downloaded and installed the program Praat (free available at www.praat.org) on your computer. Than download this plug-in.
Once downloaded, unzip the folder entitled plugin_PHONANIUM_Cepstrography_v.01.02 and place it in the following directory (i.e., the preferences directory of the program Praat), depending on your computer operating system and the name of the user (for example ‘Emiel’):
- Windows (Vista or later): C:\Users\Emiel\Praat\.
- Mac OSX: /Users/Emiel/Library/Preferences/Praat Prefs/. (However, sometimes the Library folder is hidden on a Mac OSX. If this is the case, you first open Finder, select the Go menu, and then press the alt key ⌥. While pressing the alt key ⌥, the Library becomes available as an option in the Go menu and can then be clicked/opened.)
- Linux: /UserName/.praat-dir/.
What are cepstrum, cepstrogram and quefrency-domain?
To create a cepstrum, a Fourier transformation of an oscillogram (i.e., a complex acoustic waveform) is first executed to create a spectrum. This action means transitioning from the time-domain to the frequency-domain. In this spectrum, one expects to see clearly emerging harmonics (i.e., spectral peaks) for a recording with good voice quality. Carrying out a new Fourier transformation of the spectrum, as if this spectrum itself were a time-domain oscillogram, then creates the unsmoothed cepstrum. This is essentially a Fourier transform of a Fourier transform. The result is transitioning from the frequency-domain to the quefrency-domain (or 1/frequency-domain). In this cepstrum, one expects to see at least one clearly emerging rahmonic (i.e., cepstral peak) for a recording with good voice quality. This dominant rahmonic or cepstral peak actually reflects the strength of the fundamental frequency of the voice as it emerges out of the background competing frequencies. This implies that a more periodic voice signal carries more regularly spaced and more prominent harmonics in the spectrum that in turn correspond to a more pronounced rahmonic in the cepstrum. Thus, the rationale behind the cepstrum, as a domain for voice quality assessment, is that a more prominent cepstral peak comes from a well-defined harmonic structure in the spectrum of a more highly periodic signal, as compared to a less periodic signal.
The technique of three-dimensional display of consecutive spectra in time is called spectrography. The resultant graph is a sound spectrogram. Equivalently, the technique of three-dimensional display of consecutive cepstra in time is called cepstrography. The resultant graph is a sound cepstrogram. Finally, averaging the cepstrum across time and/or quefrency yields a smoothed cepstrum. All these labels are demonstrated in the following figure.
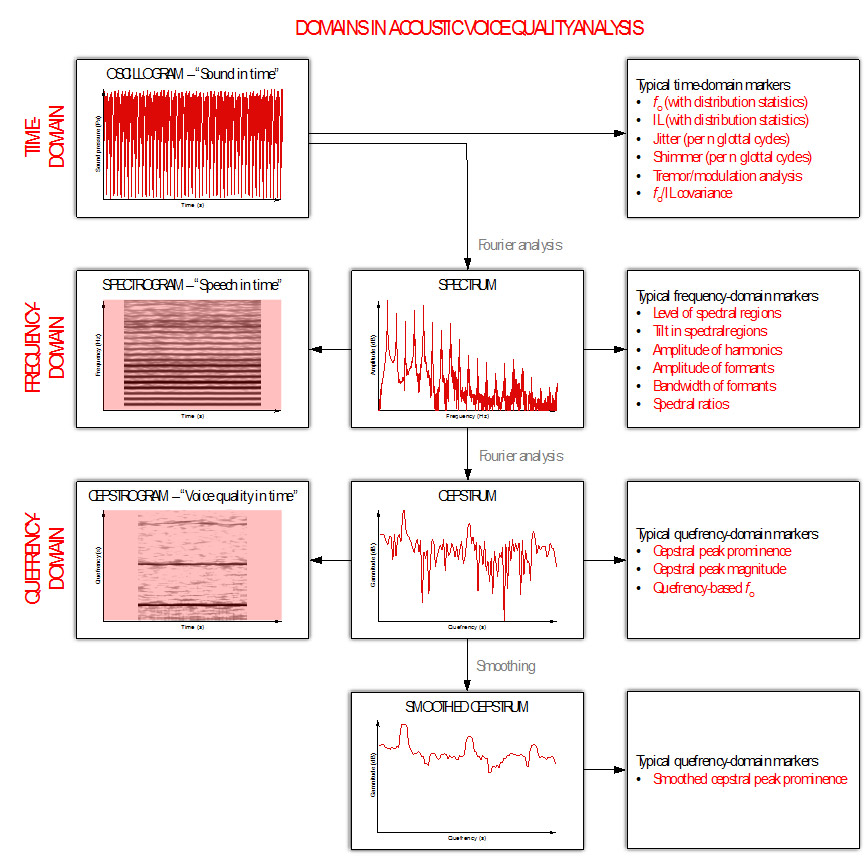
This labeling seems to be difficult, but actually it is not. To denote that the cepstrum is actually an inverse spectrum, the characters of the first syllable ‘spectrum’ have been reversed so it become ‘cepstrum’. Similar anagrams with character or syllable swaps have been introduced for the related methods: spectrum à cepstrum, analysis in spectrum à alanysis in cepstrum, filtering in spectrum à liftering in cepstrum, frequency à quefrency, magnitude à gamnitude, phase à saphe, spectrogram à cepstrogram, etc.
What is cepstral peak prominence?
As already mentioned, the degree with which the dominant rahmonic or cepstral peak emerges above the rest of the cepstrum –this is the cepstral peak prominence (i.e., CPP)– is one of the most indicative markers for overall voice quality as well as breathiness. To define the CPP, a linear regression line is fitted through the unsmoothed cepstrum and the difference in gamnitude between the cepstral peak and its corresponding point on the regression line is calculated. The smoothed cepstral peak prominence (i.e., CPPS) implies the same commands in the smoothed cepstrum. A detailed outline of the calculation of CPP and CPPS can be found in Hillenbrand et al. (1994) and Hillenbrand & Houde (1996). The following figure also illustrates graphically how CPP and CPPS are determined.
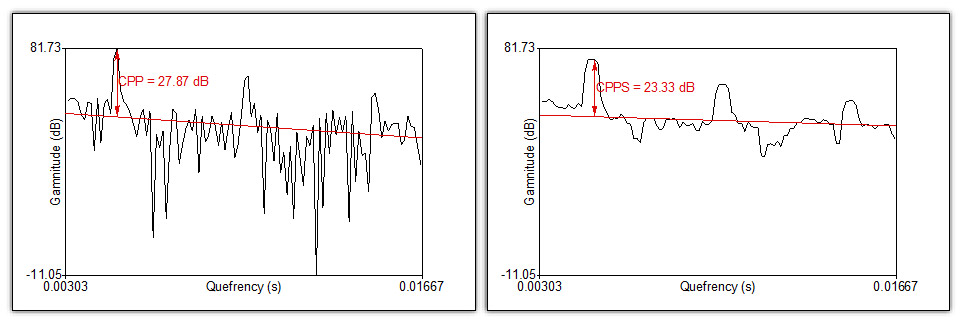
Since Maryn & Weenink (2015) it is possible to work with cepstra and cepstrograms as well as to determine CPPS in the program Praat. With PHONANIUM’s script for cepstrography and quefrency-domain analyses, several relevant cepstral analyses are automated to assess voice quality across the voice signal recording.
What is the clinical value of the sound cepstrogram?
The actual power of PHONANIUM’s sound cepstrography script in the voice and speech clinic can be found in its potential to visualize voice quality related changes as measured in CPPS across the voice signal.
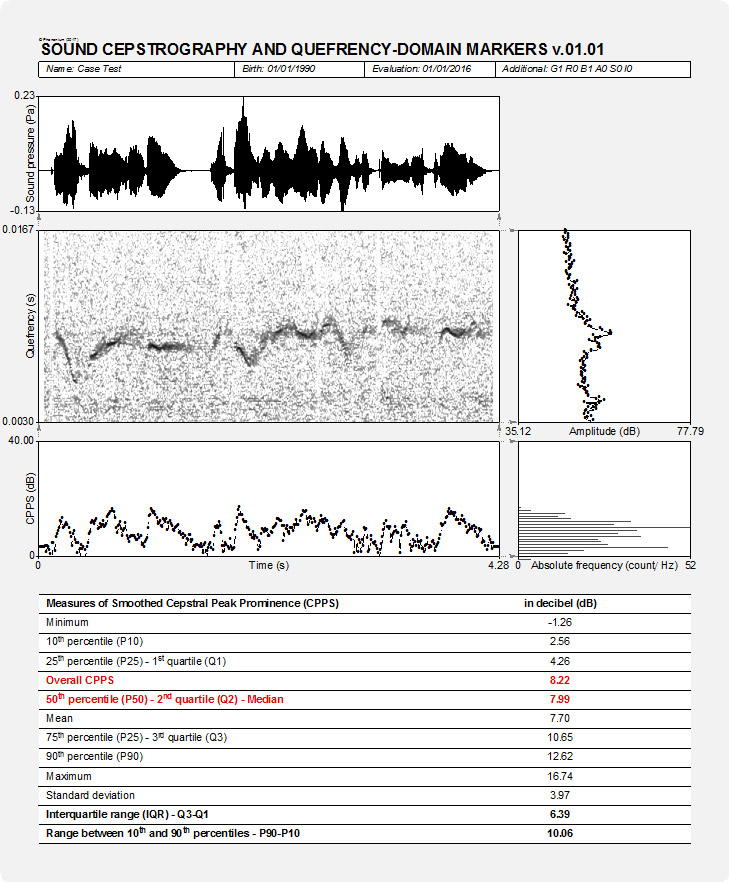
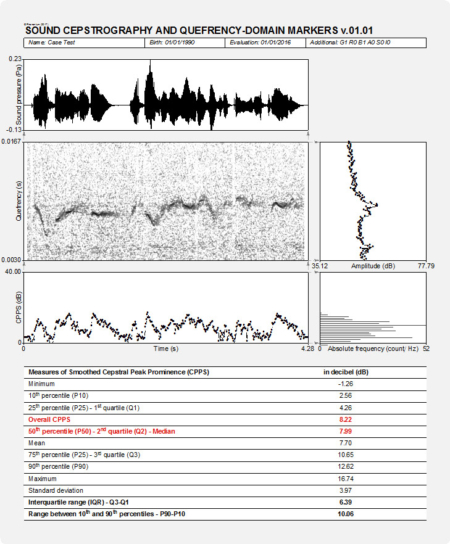
In the output of PHONANIUM’s sound cepstrography script, a complementary set of charts and statistics are shown to accompany the auditory-perceptual interpretation of voice quality. In this example, the sentence ‘cepstral analyses of voice signals’ produced by a normophonic male was recorded. The top graph is an oscillogram (i.e., the acoustic waveform, as captured by the microphone and digitized by the sound card). The left graph in the middle represents the sound cepstrogram depicting the cepstral configuration between 0.00303 s (corresponding with an upper fo boundary of 1/0.00303 = 330 Hz) and 0.01667 s (corresponding with a lower fo boundary of 1/0.01667 = 60 Hz). The right graph in the middle graph is the average cepstrum (i.e., a summary of all discrete sound cepstra across the duration of the sample under investigation) with quefrency from bottom to top aligned with the sound cepstrogram. The bottom left graph is a CPPS-time-plot: it shows how the CPPS marker fluctuates across the recorded voice signal. The bottom right graph is a histogram that shows the distribution of CPPS aligned with the CPPS-time-graph. In this example, with a sentence containing both voiced (i.e., high voice quality) and unvoiced (i.e., low voice quality) segments, CPPS is clearly fluctuating as can be seen immediately in both CPPS-time-plot and CPPS-histogram. Underneath these figures there is all information regarding the distribution of CPPS in time: minimum, 10th-25th-75th-90th percentiles, mean, median, standard deviation, interquartile range and range between 10th and 90th percentile. Finally, this script also provides the overall CPPS as described in Maryn & Weenink (2015).
Phonanium’s script for sound spectrography: specific features
Pre-analysis functions and formatting
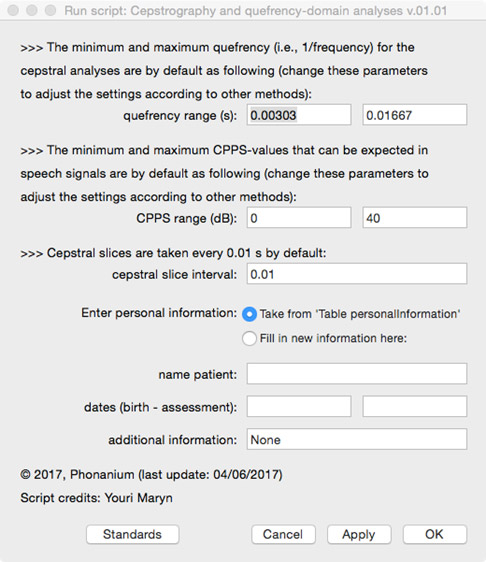
Before analyzing the voice/speech signal, the user is prompted in a form:
- to decide on quefrency analysis range;
- to decide on CPPS range;
- to decide on the interval duration between successive cepstra (for the averaged cepstrum, the CPPS-time-plot and the CPPS-histogram);
- to enter personal information (i.e., name, date of birth, date of assessment and additional information) directly in this form, or to take this information after having it entered in the form of the Phonanium script entitled ‘Personal information’.
Graphical information output
- Oscillogram (sound wave)
- Sound cepstrogram
- Averaged cepstrum
- CPPS-time-plot
- CPPS-histogram
Numerical/statistical information output in Hz as well as semitone (relative to 1 Hz)
- Minimum CPPS
- 10th percentile in CPPS
- 25th percentile in CPPS
- 75th percentile in CPPS
- 90th percentile in CPPS
- Mean CPPS
- Median CPPS
- Overall CPPS (according to Maryn & Weenink, 2015)
- Maximum CPPS
- Standard deviation in CPPS
- Interquartile range in CPPS
- Range between 10th and 90th percentiles in CPPS
Important: quality of sound recording
Many of the acoustic analyses and clinically relevant voice markers in the scripts of PHONANIUM imply sophisticated and complex procedures. However, when they are run on signals with bad recording quality, they loose their clinical value in terms of validity and reliability. So, prior to undertaking high-standard acoustic voice analyses, clinicians have to make well-considered choices in all of the following elements in the audio recording chain: room acoustics and ambient noise, type and placement of microphone, microphone preamplifier, and digital audio capturing device. To sample all relevant vocalizations and speech tokens as least polluted by recording-related noise as possible is what it essentially comes down to. For example Maryn (2017) offers an overview on how to deal with this.
Click here to visit PHONANIUM’s page on how to minimize recording-related influences on voice/speech signals.
Important: use the ‘Personal information’ script
With the script ‘Personal information v.01.02’ the user can complete an electronic form with the subject’s/patient’s name, date of birth, date of assessment, and optionally extra information. All this information (a) is than written into a table, (b) will be consulted by the other PHONANIUM scripts if the option “Take from ‘Table personalInformation’” is selected, and (c) will be written automatically in the output of these scripts. This increases the user-friendliness of working with PHONANIUM scripts in the program Praat, as the user/clinician has to complete this personal information only once during the entire voice assessment session.
Click here to visit PHONANIUM’s page on this ‘Personal information v.01.02’ script.
Disclaimer
For customers in the EU: this software currently has no CE certification. We are in the process of application. In the meantime, this software can be used for scientific as well as educational/learning purposes.
Program Praat
Click here to visit the website where the program Praat (Paul Boersma & David Weenink, Institute for Phonetic Sciences, University of Amsterdam, The Netherlands) can be downloaded. This software runs under the GNU General Public License. Click here to download this license.
References
Halberstam B (2004). Acoustic and perceptual parameters relating to connected speech are more reliable measures of hoarseness than parameters relating to sustained vowels. ORL Journal for Otorhinolaryngology and Its Related Specialties, 66, 70-73.
Heman-Ackah YD, Michael DD, Goding GS Jr (2002). The relationship between cepstral peak prominence and selected parameters of dysphonia. Journal of Voice, 16, 20-27.
Heman-Ackah YD, Sataloff RT, Laureyns G, Lurie D, Michael DD, Heuer R, Rubin A, Eller R, Chandran S, Abaza M, Lyons K, Divi V, Lott J, Johnson J, Hillenbrand J (2014). Quantifying the cepstral peak prominence, a measure of dysphonia. Journal of Voice, 28, 783-788.
Hillenbrand J, Cleveland RA, Erickson RL (1994). Acoustic correlates of breathy vocal quality. Journal of Speech and Hearing Research, 37, 769-778.
Hillenbrand J, Houde RA (1996). Acoustic correlates of breathy vocal quality: dysphonic voices and continuous speech. Journal of Speech and Hearing Research, 39, 311-321.
Lowell SY, Colton RH, Kelley RT, Mizia SA (2013). Predictive value and discriminant capacity of cepstral- and spectral-based measures during continuous speech. Journal of Voice, 27, 393-400.
Maryn Y, Roy N, De Bodt M, Van Cauwenberge P, Corthals P (2009). Acoustic measurement of overall voice quality: a meta-analysis. Journal of the Acoustical Society of America, 126, 2619-2634.
Maryn Y, Corthals P, Van Cauwenberge P, Roy N, De Bodt M (2010). Toward improved ecological validity in the acoustic measurement of overall voice quality: combining continuous speech and sustained vowels. Journal of Voice, 24, 540-555.
Maryn Y, Weenink D (2015). Objective dysphonia measures in the program Praat: smoothed cepstral peak prominence and acoustic voice quality index. Journal of Voice, 29, 35-43.
Maryn Y (2017). Practical acoustics in clinical voice assessment: a Praat primer. Perspectives of the ASHA Special Interest Groups, SIG3, 2, Part 1.
Additional information on cepstral methods
Bogert BP, Healy MJR, Tukey JW (1963). The quefrency alanysis of time series for echoes: cepstrum, pseudo autocovariance, cross-cepstrum and saphe cracking. In Rosenblatt M (editor): Proceedings of the symposium on time series analysis. Chapter 15, 209-243. New York, NJ: Wiley.
Noll AM (1964). Short-time spectrum and “cepstrum” techniques for vocal-pitch detection. Journal of the Acoustical Society of America, 36, 296-302.
Noll AM (1967). Cepstrum pitch determination. Journal of the Acoustical Society of America, 41, 293-309.
Updates
Cepstrography v.01.02, 29/01/2019
- Addition of a free field for the gender entry under ‘personal information’, to account for issues related to gender diversity.




Reviews
There are no reviews yet.