Description
Speech-to-noise ratio and Voice-to-noise ratio (v.01.02)
Quality of sound recordings
PHONANIUM offers various scripts for the acoustic measurement of voice/speech signals in the program Praat. However, regardless the sophistication and quality of their acoustic signal processing, most of the scripts loose their clinical value when used on recordings with insufficient quality. What it essentially comes down to, is that all relevant vocalizations and speech tokens are as least as possible polluted by recording-related noise (i.e., that they are sampled as uncontaminated and clean as possible). In other words, doing acoustic analyses in the realm of clinical voice/speech assessment only makes sense when the recording procedures and technology itself have no significant influence on their numerical and/or graphical output. It is therefore pivotal to first establish the complete recording systems’ suitability before applying acoustic analysis methods to voice/speech signals. A key marker to assess whether a recording system is appropriate for this purpose is the signal-to-noise ratio.
Author of the Speech-to-noise ratio and Voice-to-noise ratio v.01.02 script
Youri Maryn
Included in this download
- Access to tutorial video with concise theory and illustration(s) on how to evaluate the quality of sound recordings
- Access to tutorial video on how to work with the Personal information – New file script
- Access to tutorial video on how to implement/install plug-ins in the program Praat
- This plug-in
Plug-in details
Name of plug-in
plugin_PHONANIUM_SNR-VNR_v.01.02
Content of plug-in
- Speech-to-noise ratio or Voice-to-noise ratio v.01.02.praat: to analyze the speech-to-noise ratio and voice-to-noise ratio of audio recording with PHONANIUM’s script in the program Praat.
- setup.praat: to couple this script to a button in the dynamic menu of the program Praat.
How to install this plug-in?
First, make sure to have downloaded and installed the program Praat (free available at www.praat.org) on your computer. Than download this plug-in.
Once downloaded, unzip the folder entitled plugin_PHONANIUM_SNR-VNR_v.01.02 and place it in the following directory (i.e., the preferences directory of the program Praat), depending on your computer operating system and the name of the user (for example ‘Emiel’):
- Windows (Vista or later): C:\Users\Emiel\Praat\.
- Mac OSX: /Users/Emiel/Library/Preferences/Praat Prefs/. (However, sometimes the Library folder is hidden on a Mac OSX. If this is the case, you first open Finder, select the Go menu, and then press the alt key ⌥. While pressing the alt key ⌥, the Library becomes available as an option in the Go menu and can then be clicked/opened.)
- Linux: /UserName/.praat-dir/.
What recording-related items should be controlled?
Before carrying out acoustic voice/speech analyses, clinicians have to make well-considered choices in all of the following elements of sound recording chain. Maryn (2017) provides an overview with some voice research-based recommendations pertaining to sound recording environment and equipment for clinical measurement purposes. Additional explanations can be found in Hunter et al. (2007), Howard & Murphy (2008) and (Švec & Granqvist, 2010).
First, room acoustics and environmental noise can interfere with the integrity of the direct voice signal itself and consequently its analyses (Howard & Murphy, 2008, pp. 67-91; Maryn et al., 2016). This means that voice/speech signals should be recorded in as quiet as possible surroundings, and that the clinician should strive for environs that are minimally contaminated by relevant reverberations/echoes, air-borne noise (e.g., computer ventilation or airconditioning) and/or structure-borne noise (e.g., closing of doors or foot steps in corridor). Reverberation time (i.e., the time in which the intensity level decreases with 60 dB) is an important marker of how echoic a room actually is, and for sound recording purposes reverberation times should not exceed 1.0 s (Alton Everest, 1989). Consequently, longer reverberation times have to be avoided. This can be achieved by using surface materials with relatively high acoustic absorption (e.g., heavy carpet and curtains) instead of surface materials with relatively low acoustic absorption (e.g., wooden floor, painted plaster and glass windows).
Second, recording equipment can interfere with the waveform and spectral contour of the voice/speech signal. Especially type and placement of microphone affect the voice signal and its acoustic markers (Titze & Winholtz, 1993; Winholtz & Titze, 1997; Parsa et al., 2001), and the clinician should at least verify the following characteristics in the microphone’s manual (Švec & Granqvist, 2010): transducer type, frequency range, frequency response, directionality, and dynamic range. The clinician than chooses a microphone depending on what it has to be used for and on the vocalizations and speech tasks that have to be recorded.
Third, for an eventual microphone preamplifier, at least the following elements should be controlled by the clinician (Švec & Granqvist, 2010): input impedance, dynamic range, frequency range and response, and powering.
Fourth, the clinician should also consider the following facets of the digital audio capturing device (Švec & Granqvist, 2010): bit resolution (Ternström & Granqvist, 2010), maximum input level, and sampling rate (Deliyski et al., 2005b).
PHONANIUM’s signal-to-noise ratio’s
The signal-to-noise ratio usually is obtained as following. First, determine the average sound intensity level of (parts of) the recording with voice/speech sound (i.e., signal or S). Second, determine the average sound intensity level of (parts of) the recording in the absence of voice/speech sound (i.e., noise or N). Third, subtract the noise level from the signal level to yield the signal-to-noise ratio. The higher the signal-to-noise ratio, the weaker the influence of recording-related noise, the higher the fidelity of the audio recording system, and the more reliable the outcome of acoustic voice/speech measures. According to Deliyski et al. (2005a), a signal-to-noise ratio ≥ 42 dB is recommended to keep relative error in perturbation measurements below 1% (although signal-to-noise ratio = ≥ 30 dB was still considered to be acceptable). Once this recommendation is met, voice clinicians can relatively safely start recording and consequently analyzing whatever phonatory sound is needed to be assessed.
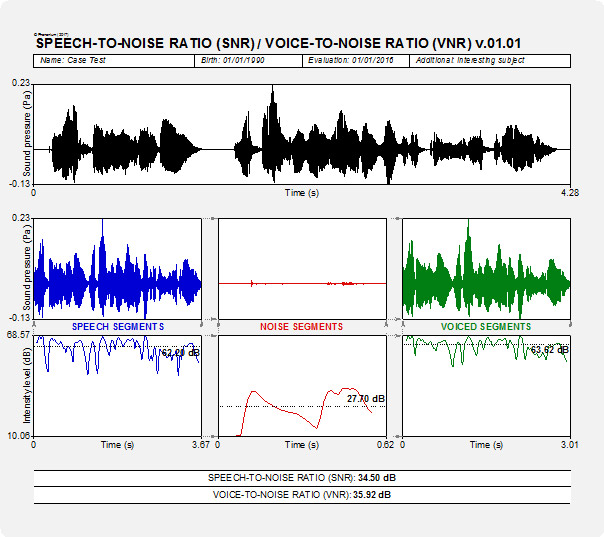
However, what ‘signal’ is the clinician interested in? This depends on the type of analyses. The clinician will probably focus more on voiced segments during voice assessment, and more on all speech segments during speech assessment. PHONANIUM’s script therefore offers two signal-to-noise ratio’s: speech-to-noise ratio (i.e., SNR) and voice-to-noise ratio (i.e., VNR). The speech-to-noise ratio is the measure of the difference in intensity level between concatenations of all ‘sounding’ segments and all ‘silent’ segments. A ‘sounding’ or speech segment is arbitrarily defined as a part that for at least 0.05 s is louder than 25 dB below the loudest intensity level of the sound. A ‘silent’ or noise segment is arbitrarily defined as a part that for at least 0.03 s is softer than 25 dB below the loudest intensity level of the sound. This speech-to-noise ratio actually corresponds with the signal-to-noise ratio. The voice-to-noise ratio is the measure of the difference in intensity level between concatenations of all voiced segments and all ‘silent’ segments. A voiced segment is arbitrarily defined as a sound part with the following specifications: minimum fo = 60 Hz, maximum fo = 1200, silence threshold = 0.03, voicing threshold = 0.45, octave cost = 0.01, octave-jump cost = 0.35, and voiced/unvoiced cost = 0.14. Both ratio’s can be used. In the example below there is SNR = 34.01 dB and VNR = 35.58 dB. According to the recommendation of Deliyski et al. (2005a), this recording has an acceptable signal-to-noise ratio and can thus be used for acoustic voice quality assessment.
For determining the variables in this section, however, it is important to have sufficiently long ‘silent’ segments. Recordings of speech without silence segments/pauzes impedes determination of the noise part in these ratio’s. So, for the purpose of SNR/VNR calculation of clinical audio samples, it is recommended to start/end the recordings sufficiently long (e.g., 0.5 s or 1 s) respectively before/after the speech or voice sample.
Phonanium’s script for signal-to-noise ratio: specific features
Pre-analysis functions and formatting
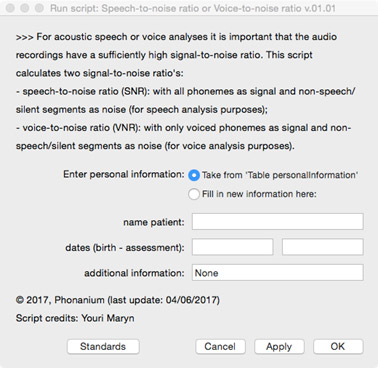
Before analyzing the voice/speech signal, the user is prompted in a first form:
- to enter personal information (i.e., name, date of birth, date of assessment and additional information) directly in this form, or to take this information after having it entered in the form of the Phonanium script entitled ‘Personal information’.
Graphical information output
- Oscillogram of complete sound recording
- Oscillogram of concatenation of speech segments
- Intensity level contour of concatenation of speech segments
- Oscillogram of concatenation of noise segments
- Intensity level contour of concatenation of noise segments
- Oscillogram of concatenation of voiced segments
- Intensity level contour of concatenation of voiced segments
Numerical/statistical information output in Hz as well as semitone (relative to 1 Hz)
- Median IL of concatenation of speech segments
- Median IL of concatenation of noise segments
- Median IL of concatenation of voiced segments
- Speech-to-noise ratio (signal-to-noise ratio)
- Voice-to-noise ratio
Important: use the ‘Personal information’ script
With the script ‘Personal information v.01.02’ the user can complete an electronic form with the subject’s/patient’s name, date of birth, date of assessment, and optionally extra information. All this information (a) is than written into a table, (b) will be consulted by the other PHONANIUM scripts if the option “Take from ‘Table personalInformation’” is selected, and (c) will be written automatically in the output of these scripts. This increases the user-friendliness of working with PHONANIUM scripts in the program Praat, as the user/clinician has to complete this personal information only once during the entire voice assessment session.
Click here to visit PHONANIUM’s page on this ‘Personal information v.01.02’ script.
Disclaimer
For customers in the EU: this software currently has no CE certification. We are in the process of application. In the meantime, this software can be used for scientific as well as educational/learning purposes.
Program Praat
Click here to visit the website where the program Praat (Paul Boersma & David Weenink, Institute for Phonetic Sciences, University of Amsterdam, The Netherlands) can be downloaded. This software runs under the GNU General Public License. Click here to download this license.
References
Alton Everest F (1989). The master handbook of acoustics (2nd ed.). Blue Ridge Summit, PA: Tab Books Inc.
Deliyski DD, Shaw HS, Evans MK (2005a). Adverse effects of environmental noise on acoustic voice quality measurements. Journal of Voice, 19, 15-28.
Deliyski DD, Shaw HS, Evans MK (2005b). Influence of sampling rate on accuracy and reliability of acoustic voice analysis. Logopedics Phoniatrics Vocology, 30, 55-62.
Howard DM, Murphy DT (2008). Voice science, acoustics and recording. San Diego, CA: Plural Publishing Inc.
Hunter EJ, Spielman J, Starr A, Popolo P (2007). Acoustic voice recording, “I am seeking recommendations for voice recording hardware …”. Perspectives on Voice and Voice Disorders, 17, 7-14.
Maryn Y, Ysenbaert F, Zarowski A, Vanspauwen R (2016). Mobile communication devices, ambient noise, and acoustic voice measures. Journal of Voice, Sep 27, Epub ahead of print.
Maryn Y (2017). Practical acoustics in clinical voice assessment: a Praat primer. Perspectives of the ASHA Special Interest Groups, SIG3, 2, Part 1.
Parsa V, Jamieson DG, Pretty BR (2001). Effects of microphone type on acoustic measures of voice. Journal of Voice, 15, 331-343.
Švec JG, Granqvist S (2010). Guidelines for selecting microphones for human voice production research. American Journal of Speech-Language Pathology, 19, 356-368.
Ternström S, Granqvist S (2010). Personal computers in the voice laboratory: part two–audio devices. Logopedics Phoniatrics Vocology, 35, 98-102.
Titze IR, Winholtz WS (1993). Effect of microphone type and placement on voice perturbation measurements. Journal of Speech and Hearing Research, 36, 1177-1190.
Winholtz WS, Titze IR (1997). Miniature head-mounted microphone for voice perturbation analysis. Journal of Speech, Language, and Hearing Research, 40, 894-899.
Additional reading on vocal fo, perceived pitch and related issues
Kent RD, Read C (2002). Acoustic analysis of speech (2nd edition). San Diego, CA: Singular Publishing Group.
Titze I (1995). Workshop on acoustic voice analysis: summary statement. Iowa City, IA: National Center for Voice and Speech.
Updates
Speech-to-noise ratio and Voice-to-noise ratio (v.01.02), 27/01/2019
- Addition of a free field for the gender entry in the personal information file, to account for issues related to gender diversity.


Reviews
There are no reviews yet.